
Executive Forensic Thesis
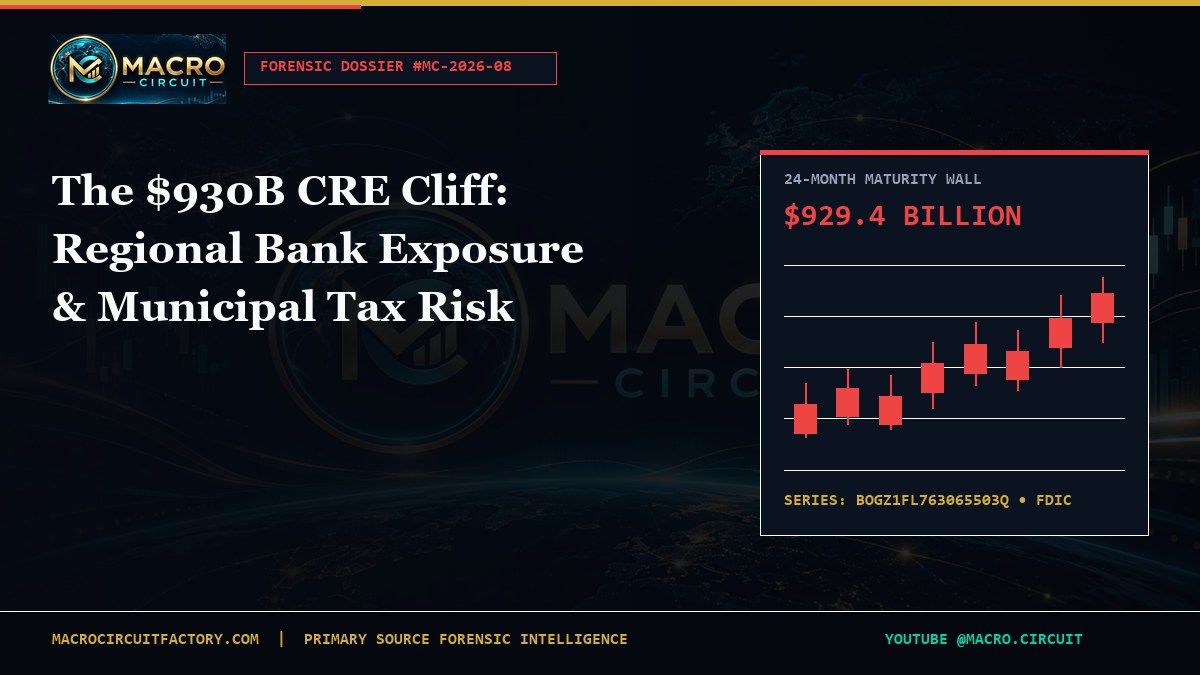
Nearly $930 billion in US commercial real estate (CRE) mortgages face maturity or rate-cap expiration over the next twenty-four months, with domestic regional and community banks (<$250B assets) holding roughly two-thirds of bank-held CRE exposure.
FDIC Call Report footnotes show widespread reliance on short-term loan modifications and interest-reserve extensions ('extend and pretend') that defer realized charge-offs while freezing fresh small-business and construction credit.
As Class B and C urban office towers clear distressed sales at 45% to 65% discounts to 2019 appraisals, successful tax-assessment appeals shift hundreds of millions of dollars in municipal budget shortfalls directly onto residential homeowners and local sales taxes.
Audited Primary Source Data Table
| Series ID | Issuing Agency | Metric | Latest | Prior | 3Y Delta |
|---|---|---|---|---|---|
| BOGZ1FL763065503Q | Federal Reserve Z.1 | U.S.-Chartered Depository Institutions: Commercial Mortgages | $2.98T | $2.94T | +11.2% |
| DRCRELEXFACBS | Federal Reserve / FRED | Delinquency Rate on Commercial Real Estate Loans (All Banks) | 1.58% | 1.42% | +92 bps |
| TREPP-OFF-SS | Trepp CMBS Benchmark | CMBS Office Special Servicing Rate | 11.4% | 10.3% | +845 bps |
| SUBLPDCILS | Federal Reserve SLOOS | Net % of Banks Tightening Standards for CRE Loans | +31.4% | +36.8% | 11 Consecutive Tight Quarters |
1. Sizing the $930 Billion Commercial Mortgage Refinancing Wall
Unlike the American single-family homeowner market—dominated by thirty-year self-amortizing fixed-rate mortgages—commercial real estate operates on five-, seven-, and ten-year balloon notes with minimal principal amortization. Loans originated during the low-volatility 2019–2021 window at 3.50% to 4.25% interest rates and 65% loan-to-value ratios are now hitting hard maturity dates in a 6.50% to 7.75% refinancing regime.
Mortgage Bankers Association and securitized CMBS loan-tape audits indicate roughly $929.4 billion of commercial and multifamily debt matures within a rolling twenty-four-month window. Even properties with stable net operating income (NOI) face severe 'refinance gap' math: when debt-service constants jump 275 basis points and exit capitalization rates expand from 5.0% to 7.25%, maximum supportable senior debt shrinks by 30% to 45%.
Borrowers unable or unwilling to inject fresh rescue equity at negative leverage increasingly hand keys back to special servicers in non-recourse CMBS structures—or negotiate quiet twelve-to-twenty-four-month maturity extensions with relationship regional banks.
2. Regional Depository Concentration vs. Money-Center Insulation
Systemic banking risk in the current CRE cycle looks nothing like 2008. America's top eight Global Systemically Important Banks (GSIBs) hold heavily diversified fee, trading, credit-card, and corporate lending franchises, keeping direct non-owner-occupied CRE loans below 12% of total loans.
Step down into the $10 billion to $100 billion regional and community bank tier, however, and Federal Reserve H.8 and FDIC Call Report data reveal over 480 depository institutions carrying CRE-to-Tier-1-Capital ratios above the 300% regulatory supervisory guidance threshold—compounded by unrealized mark-to-market losses in held-to-maturity agency MBS securities portfolios.
Rather than triggering chaotic weekend bank runs, this balance-sheet overhang manifests as 'zombie intermediation': regional banks preserve statutory capital ratios by shrinking new commercial-and-industrial (C&I) and construction commitments, steadily ceding market share to private-credit debt funds charging SOFR + 550 bps.
3. Securitized CMBS Transparency vs. Bank Modification Opacity
Comparing securitized CMBS delinquency rates against bank Call Report CRE delinquency rates exposes a striking valuation lag. In securitized office CMBS—governed by strict REMIC servicing rules and transparent monthly trustee remittances—delinquency and special-servicing rates have climbed past 11.4%, with distressed liquidations routinely realizing 45% to 65% loss severities on Class B/C central-business-district collateral.
Across commercial bank balance sheets, reported CRE delinquency sits below 1.6%—not because bank-held suburban and urban loans possess superior collateral fundamentals, but because accounting rules permit lenders to extend maturity dates in exchange for partial principal paydowns or replenished interest reserves without triggering immediate collateral liquidation.
While gradual workout smoothing prevents disorderly fire sales, it prolongs credit tightness across regional economies for years.
4. Beyond Office: Floating-Rate Sunbelt Multifamily Bridge Loans
Office buildings capture headlines, yet floating-rate multifamily bridge loans originated at the 2021–2022 peak represent the second major workout tranche. Value-add syndicators acquired 1980s and 1990s Sunbelt apartment complexes at sub-4.0% cap rates using three-year floating-rate CLO debt paired with expiring SOFR interest-rate caps.
As record multifamily construction completions flattened Sunbelt asking rents while property insurance (+38%) and municipal taxes surged, actual net operating income fell 15% to 25% short of pro-forma underwriting just as interest-rate cap replacement costs soared.
CLO buyout activity and mezzanine rescue preferred-equity infusions are gradually clearing these assets, resetting cost bases lower for disciplined institutional buyers while wiping out 2021-vintage common equity syndications.
5. The Urban Property-Tax Transfer to Homeowners and Commuters
Commercial office and retail properties historically subsidized municipal budgets in major US metros—contributing 20% to 35% of total city property tax revenues while consuming minimal public-school resources. As distressed tower transactions establish lower comparable market values from San Francisco, Chicago, and Washington D.C. to Boston, Minneapolis, and New York, building owners file aggressive tax certiorari assessment appeals.
Municipal finance law is unforgiving: when commercial assessed values contract inside a fixed-levy jurisdiction, tax rates automatically shift onto the remaining tax base—primarily residential homeowners and neighborhood small businesses—unless cities enact deep municipal service cuts or raise transit fares, parking fees, and local sales taxes.
Commercial real estate repricing thus loops directly back into the household cost-of-living squeeze documented in our 50-State Economic Stress Map.
6. Credit Cycle Timeline and Distressed Capital Deployment
With over $180 billion in dry powder accumulated inside opportunistic real estate debt and equity vehicles, private capital stands ready to recapitalize trophy Class A properties and well-located residential infill projects once sellers capitulate to realistic 7.0%+ unlevered yields.
Investors tracking regional bank equities (`KRE`) and municipal general-obligation credit must audit bank-level CRE maturity schedules, non-accrual migration velocity, and commercial-to-residential tax digest ratios through late 2027.
Primary-source FDIC Call Report schedules (`RC-C` and `RC-N`) and CMBS trustee tapes remain the indispensable forensic tools separating resilient balance sheets from delayed impairment.
7. Accounting Mechanics: Post-TDR Loan Modifications Under ASU 2022-02
To grasp why reported bank CRE non-performing loan ratios remain deceptively low while securitized CMBS defaults surge, credit analysts must examine Financial Accounting Standards Board (FASB) Accounting Standards Update 2022-02, which eliminated legacy Troubled Debt Restructuring (TDR) accounting designations for CECL-adopting institutions.
Under current supervisory guidance issued jointly by the Federal Reserve, FDIC, and OCC, when a regional bank grants a short-term maturity extension or temporary interest-only modification to a borrower experiencing refinancing friction—provided the borrower remains current on modified interest payments—the loan often remains classified as 'performing' rather than migrating immediately to non-accrual status.
Schedule RC-C Part I Memorandum footnotes in quarterly FDIC Call Reports disclose growing volumes of modified CRE loans to borrowers experiencing financial difficulty, yet headline Tier-1 capital ratios remain cushioned until an appraisal event or sponsorship abandonment forces a collateral-dependent charge-off.
While regulatory pragmatism averted a disorderly 1990-style Savings & Loan resolution wave, the trade-off is prolonged balance-sheet encumbrance: capital tied up supporting modified 4.25% legacy office and multifamily loans cannot be recycled into high-velocity small-business equipment or residential construction lending.
8. Quantifying Municipal General-Obligation Revenue Vulnerability Across Major Metros
City comptroller comprehensive annual financial reports (ACFRs) illustrate wide dispersion in municipal exposure to commercial property devaluations. Jurisdictions like Boston, New York, Washington D.C., San Francisco, and Chicago derive significant shares of total local-source revenues from commercial real estate assessments, real-estate transfer taxes, and downtown commuter sales/parking levies.
Because commercial tax appeals typically take eighteen to thirty-six months to wind through municipal boards of review and state tax courts, peak municipal revenue erosion arrives with a multi-year lag—peaking across FY2026 through FY2028 budgets rather than during initial post-pandemic work-from-home transitions.
Cities with split-rate tax classifications (taxing commercial parcels at 2.0x to 2.5x residential rates) face statutory caps on shifting additional burden onto remaining commercial tenants, forcing budget directors to choose between lifting residential millage levies, deferring capital maintenance, or issuing deficit-smoothing municipal debt at higher tax-exempt yields.
9. Primary Data Sources & Depository Surveillance Framework
Dossier #MC-2026-08 synthesizes four primary regulatory datasets: (1) Federal Reserve Statistical Release Z.1 *Financial Accounts of the United States* (`BOGZ1FL763065503Q` commercial mortgage liabilities); (2) Federal Reserve H.8 weekly commercial bank asset/liability tables segmented between large domestically chartered banks and small domestically chartered banks; (3) Federal Reserve Senior Loan Officer Opinion Survey (`SUBLPDCILS`); and (4) FFIEC/FDIC Central Data Repository quarterly Call Reports.
Securitized benchmark series reference Trepp and CREFC monthly CMBS remittance aggregations across conduit and single-asset single-borrower (SASB) trusts.
Download the full CSV Primary Data Pack or inspect live regional stress knock-on effects inside our 50-State US Economic Stress Map.
Broadcast Chapter Transcript & Primary Source Citations
Commercial real estate cycles never detonate overnight like subprime derivatives; they grind across five- and seven-year balloon maturities as debt-service coverage ratios breach 1.0x.
Federal Reserve H.8 balance sheet releases confirm commercial banks outside the top 25 GSIBs hold over two-thirds of domestic bank CRE loans, often exceeding 300% of Tier-1 risk-based capital.
When a downtown office tower's assessed value drops from $300 million to $110 million after a foreclosure auction, the city's revenue requirement doesn't shrink—residential taxpayers and commuters absorb the millage shift.
Frequently Asked Institutional Questions
Why do regional banks hold so much more CRE risk than giant Wall Street banks?
Banks outside the top 25 GSIBs hold roughly 67.8% of bank-held domestic commercial real estate loans, with hundreds of community and regional banks carrying CRE exposures above 300% of Tier-1 capital—whereas mega-banks hold heavily diversified global fee, trading, and consumer portfolios.
How do downtown office tower defaults raise suburban and urban homeowner taxes?
When distressed office buildings sell at 45%–65% discounts and win property tax assessment appeals, cities operating under fixed revenue levies shift millage rates onto the remaining tax base—primarily residential homeowners—while raising fees and local taxes to close budget gaps.