
0:58
+$410/mo
Why Fixed-Rate US Mortgages Still Jumped $410/Month
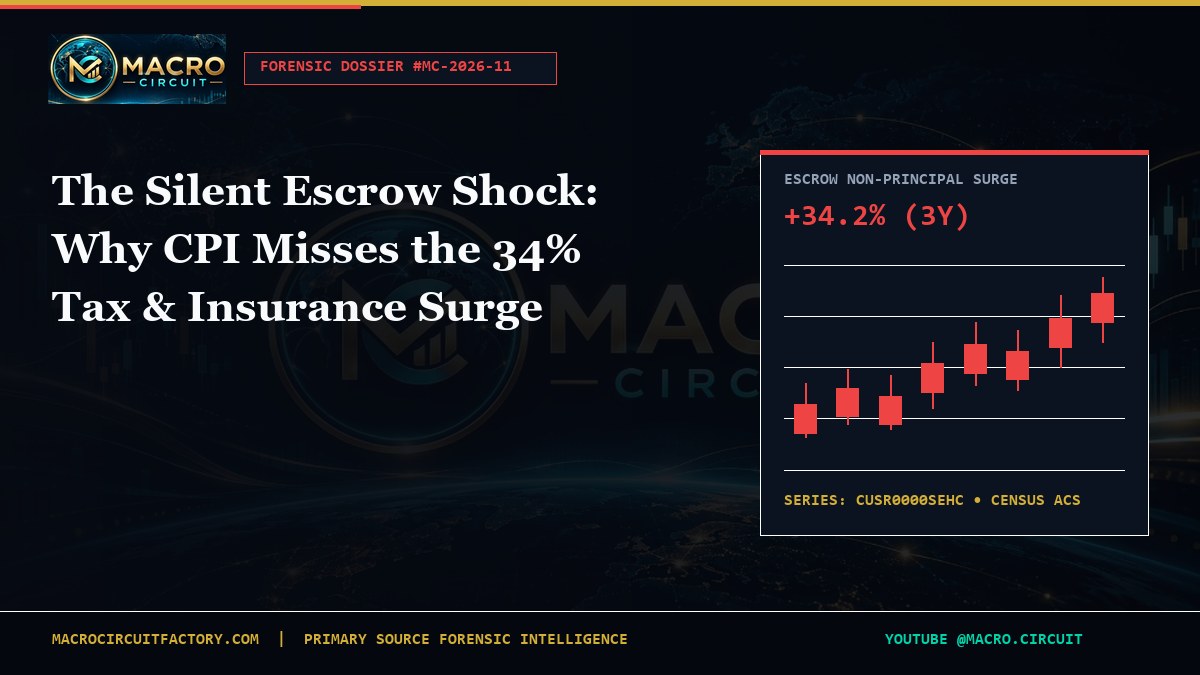
How Owners' Equivalent Rent (OER) methodology shields headline inflation from $410/month non-principal housing cost spikes across 31 US states.
| Series ID | Agency | Latest | 3Y Delta |
|---|---|---|---|
| CUSR0000SEHC | BLS / FRED | 4.9% | +18.6% |
| CPIAUCSL | BLS / FRED | 2.7% | +10.4% |
| FIO-HO3-NAT | US Treasury FIO | +12.4% YoY | +33.8% |
| ACS-B25103 | US Census Bureau | $3,690/yr | +24.7% |
| MORTGAGE30US | Freddie Mac / FRED | 6.58% | +352 bps vs 2021 |



| Rank ↕ | State ↕ | Stress (/10) ↕ | Tax/Escrow ↕ | Home Ins. ↕ | Rent/Inc ↕ |
|---|---|---|---|---|---|
| #1 | Florida (FL) | 8.9 | +34.8% | +46.2% | 36.8% |
| #2 | California (CA) | 8.6 | +26.4% | +34.8% | 35.9% |
| #3 | Hawaii (HI) | 8.4 | +23.9% | +33.6% | 36.2% |
| #4 | Texas (TX) | 8.3 | +31.9% | +39.4% | 32.9% |
| #5 | Louisiana (LA) | 8.2 | +30.4% | +43.8% | 33.6% |
| #6 | New York (NY) | 8.1 | +25.9% | +27.4% | 35.4% |
| #7 | New Jersey (NJ) | 7.9 | +25.1% | +26.8% | 34.1% |
| #8 | Colorado (CO) | 7.8 | +29.7% | +36.4% | 33.1% |
| #9 | Massachusetts (MA) | 7.7 | +22.9% | +24.9% | 34.2% |
| #10 | Arizona (AZ) | 7.6 | +25.8% | +31.2% | 32.7% |
| Date / ET | Release | Cons. | Prior |
|---|---|---|---|
| Nov 13 08:30 ET |
US Consumer Price Index (CPI-U YoY)
BLS • ▮▮▮
|
2.7% | 2.6% |
| Nov 14 08:30 ET |
Producer Price Index (Final Demand YoY)
BLS • ▮▮
|
2.3% | 2.1% |
| Nov 15 08:30 ET |
US Retail & Food Services Sales (MoM)
CENSUS • ▮▮▮
|
+0.3% | +0.4% |
| Nov 20 13:00 ET |
US Treasury 20-Year Bond Reopening Auction
TREASURY • ▮▮
|
$16.0B | 4.49% |
| Nov 27 10:00 ET |
Core PCE Price Index (Fed Preferred Gauge)
BEA • ▮▮▮
|
2.8% | 2.7% |
| Dec 16 14:00 ET |
FOMC Rate Decision & Summary of Economic Projections
FED • ▮▮▮
|
4.25-4.50% | 4.50-4.75% |
Get primary-source forensic dossiers and 50-state stress alerts delivered straight to your inbox.
Join US fixed-income analysts, corporate treasurers, and households receiving audited FRED, BLS, Treasury, and 50-state escrow stress briefings directly upon release. Zero spam. Instant one-click unsubscribe.